Antarctic Sapiens

01 · The Library — Climate & Overshoot

How to Read the Hottest Year in History (Before It Happens)

Remove the tide. The rest is ours.

Top: histogram with every model weighted equally. Bottom: model medians (dots) and 10–90% member ranges (bars), labeled with each model’s most common peak month. Dotted line: the strongest event in the observed record on this convention. (Source: Climate Brink)

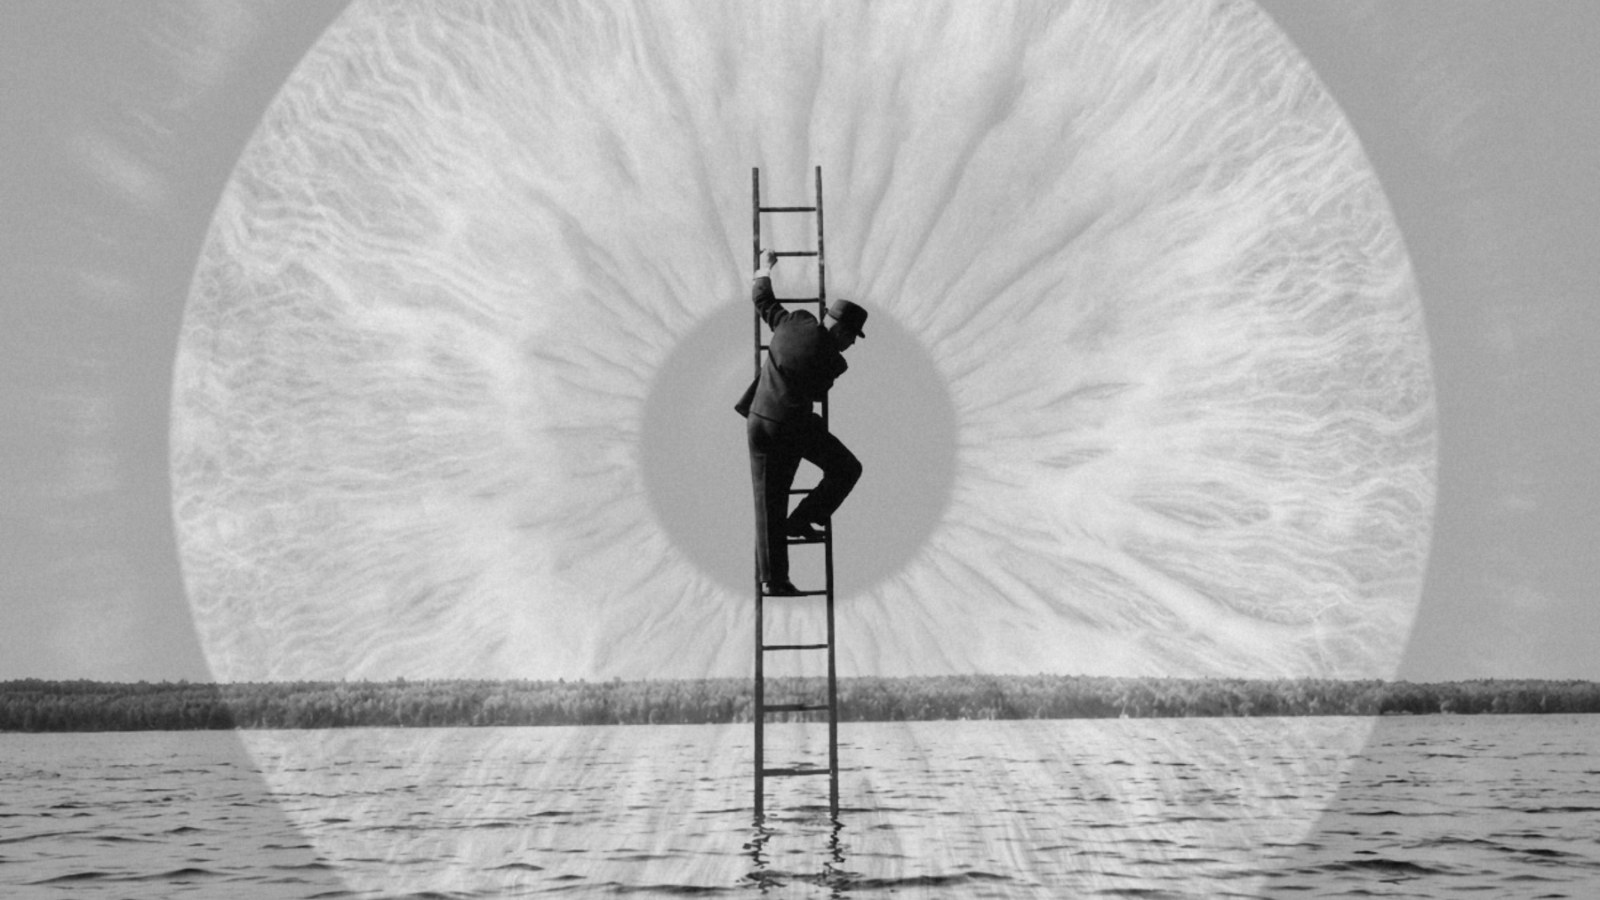
The rest is ours (created by the author. And no — I didn’t make this with AI. I pulled the image from Pinterest and built the design myself, end to end, just like I do with every single one of my covers)

Library access

This essay belongs to the Library archive.

New essays remain open for 60 days and one monthly selection stays free. A membership opens the whole archive.

Support the Library Already a member? Get your access link

Sources

Every claim in a house essay carries a source. The number beside it in the catalogue card is counted from this list, so it appears when the list does. The full bibliographic records — author, year, publisher, DOI, and an archived copy so the footnotes do not rot — move across with the migration from Substack.
Read next

Climate & Overshoot · 12 min My Mother Thinks El Niño Comes From the Sky. She’s Only Wrong About the Direction.

Independent and reader-supported. Every essay is free for its first 60 days; membership keeps the whole archive open, for USD $10 a month.If the Library is worth something to you, you can support the house. Become a member

The Studio does this work on commission: the research, the evidence and the document that carries it. Research Briefs from USD $1,000. See the Studio